 Copyright © 2002 AIS at ICS PAS, Warsaw, Poland. All rights reserved.
Information about this page format is available HERE.
Results of experiments disscussed in paper
"Immune Memory Control in Artificial Immune System"
Figure 5.
Results for experiments with 11 sizes of memory buffer (from 0 to 50) performed with two methods: single-population (Serie 1) and double-populations (Serie 2) approach for environment #4 (cyclic changes).
Mean/SE/SD: Here, the smallest box in the plot represents the mean (central tendency) of the variable, while the
dispersion (variability) is represented by ± 1 times the standard error (large box) and ± 1 times the standard
deviation about the mean ("whiskers").
Median/Quart./Range: This box plot describes the central tendency of the variable in terms of the median of the
values (represented by the smallest box in the plot). The spread (variability) in the variable values is represented in
this plot by the quartiles (the 25th and 75th percentiles, larger box in the plot) and the minimum and maximum
values of the variable (the "whiskers" in the plot).
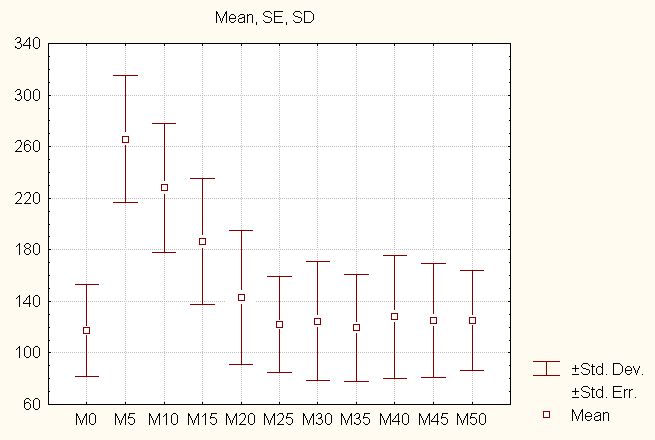
Figure 5.1. Serie 1
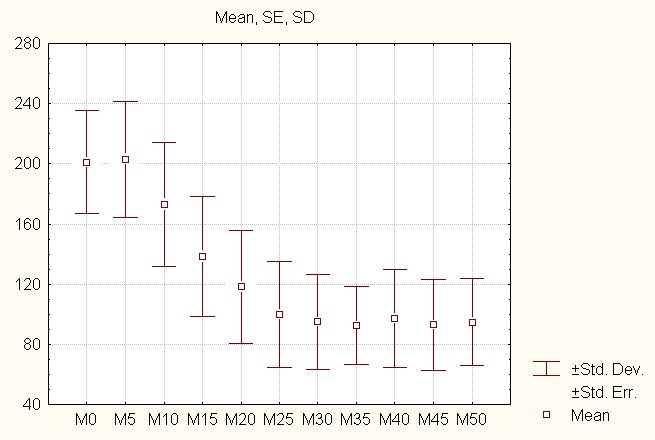
Figure 5.2. Serie 2
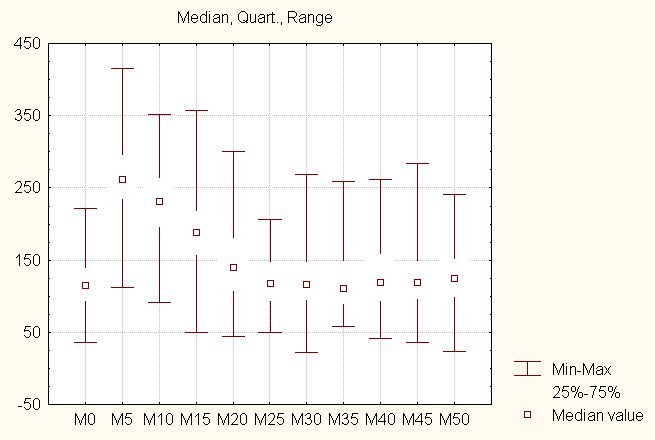
Figure 5.3. Serie 1
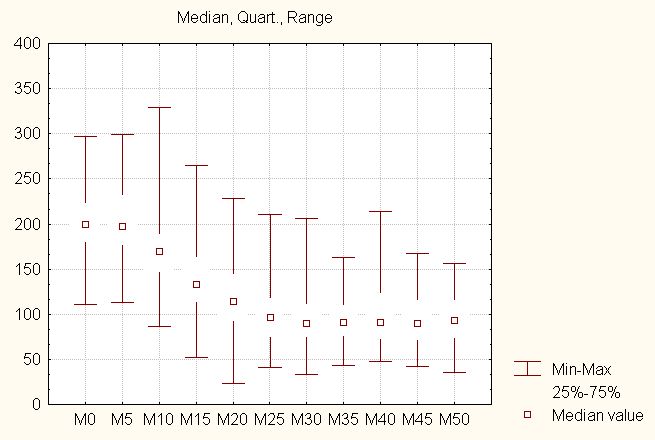
Figure 5.4. Serie 2
Copyright © 2002 AIS at ICS PAS, Warsaw, Poland. All rights reserved.
Information about this page format is available HERE.